Houston sits on a deep sedimentary basin of alluvial and coastal deposits that can exceed 10,000 feet in thickness. Much of the city is built on Beaumont and Lissie formations — clay-rich soils with interbedded sand lenses that control groundwater migration and foundation behavior. The shallow water table, often within 5 to 15 feet of the surface, combined with expansive clays, makes it tricky to predict where sand layers pinch out or where buried channels exist. That is where electrical resistivity / VES comes in. By measuring how the ground resists current flow at increasing electrode spacings, we create a vertical resistivity profile that reveals changes in lithology, moisture content, and pore-fluid salinity without drilling. Before mobilizing a drill rig for a deep foundation design, many teams run a VES survey to decide optimal borehole locations. It is also a fast way to correlate with capacidad de carga estimates in variable alluvial sequences typical of the Gulf Coast plain.
A single VES line in Houston can map a buried sand channel or a clay dome that would otherwise require five or more exploratory boreholes to identify.
Methodology and scope
We follow ASTM G57-06 for field resistivity measurements and interpret the apparent resistivity curves using IPI2win or similar inversion software. Each survey line is deployed with a Wenner or Schlumberger array depending on target depth — typically 30 to 100 meters of investigation. In Houston, where clay layers can mask deeper sand bodies, we combine VES with ensayo CPT to verify resistivity anomalies with direct cone penetration data. The equipment is calibrated annually and the entire procedure is documented under our ISO 17025 quality system. The key parameters we extract include:
Apparent resistivity vs. electrode spacing (raw field curve)
Inverted layer resistivities and thicknesses (1-D model)
Interpreted lithology based on resistivity ranges (clay = 1–20 Ω·m, sand = 20–200 Ω·m, gravel >200 Ω·m)
Depth to resistive bedrock or top of sand aquifer
Correlation with groundwater salinity (TDS inferred from resistivity)
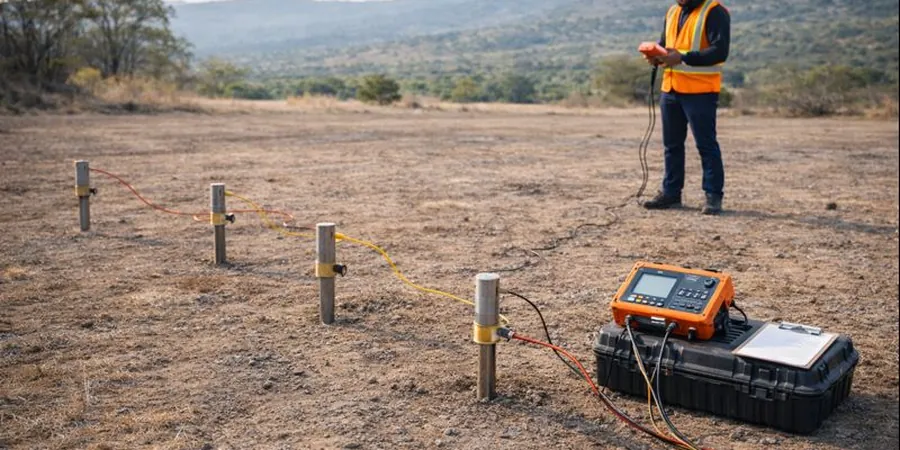
Technical reference image — Houston
Local considerations
The most common mistake we see in Houston is assuming that the stiff clay layer at the surface extends uniformly across the entire site. In many subdivisions built on former rice fields or meander belts, a sand lens or a buried stream channel cuts right through that clay at shallow depth. If a foundation is designed for uniform clay bearing but hits a loose sand layer just 6 feet down, differential settlement or even bearing failure can occur. An electrical resistivity / VES survey caught this exact situation on a recent apartment project in Katy: the VES profile showed a low-resistivity layer at 8–14 ft that turned out to be a water-saturated sand seam, which the geotechnical report had missed because the boreholes were spaced 100 ft apart.
Classic 1-D sounding using Wenner or Schlumberger arrays. Best for deep profiling (up to 100 m) to detect bedrock, aquifer boundaries, or thick clay sequences. Typical turnaround: 48 hours for field data + 1 week for inversion and report.
02
2-D Resistivity Imaging
Multi-electrode continuous profiling (dipole-dipole or Wenner-alpha) for mapping lateral changes. Ideal for detecting buried channels, faults, or contaminant plumes. Output includes inverted resistivity cross-section with topography.
03
Corrosion Potential Survey
Targeted resistivity mapping for pipeline and utility corridors. We measure soil resistivity at 5 ft and 10 ft depths to classify corrosivity per ASTM G57 and NACE SP0169. Combined with pH and redox measurements for a complete corrosion assessment.
04
Groundwater Salinity & Aquifer Mapping
Uses VES profiles to infer total dissolved solids (TDS) from resistivity values. Helps locate fresh-water lenses in coastal aquifers or map saltwater intrusion fronts — common in the Houston Ship Channel area.
Applicable standards
ASTM G57-06 — Standard Test Method for Field Measurement of Soil Resistivity, IBC 2021 — Section 1803 (Geotechnical Investigation) and 1806 (Presumptive Load-Bearing Values), ASCE 7-22 — Chapter 11 (Seismic Design Criteria — site class correlation via resistivity)
Frequently asked questions
What is the difference between electrical resistivity / VES and a standard geotechnical boring?
A boring gives you a direct sample at discrete points — you see the soil at that exact location. VES gives you a continuous vertical profile of resistivity vs. depth, which correlates to lithology and moisture content but does not replace a physical sample. We recommend using VES as a reconnaissance tool to optimize boring locations and reduce the number of holes needed.
How deep can a VES survey reach in Houston soils?
With a standard Wenner array and maximum electrode spacing of 50 m, we can resolve layers down to about 40–50 m (130–165 ft). For deeper targets (up to 100 m), we use a Schlumberger array with larger current electrode separation. The actual depth depends on the resistivity contrast and the noise level — in Houston's clay-rich environment, we typically get good signal to 60 m.
Can VES detect the depth to bedrock in Houston?
In most of Houston, bedrock (typically the Cretaceous Glen Rose limestone or deeper) lies 2,000 to 10,000 ft below ground — far beyond the range of any surface resistivity method. VES is not used for bedrock depth here. Instead, it is excellent for mapping the base of the Beaumont clay (typically 30–80 ft deep) or detecting sand bodies within the alluvial sequence that affect foundation design.
How much does an electrical resistivity / VES survey cost in Houston?
For a standard VES with one array and 1-D inversion, you can expect to pay between US$670 and US$1,110 per sounding, depending on the number of points, access difficulty, and whether you need a full report with interpreted cross-sections. Volume discounts apply for multi-site projects. Always request a quote specific to your site conditions.
What is the typical turnaround time for a VES survey in the Houston area?
Fieldwork usually takes one day per 4–6 soundings. Data inversion and reporting take another 3–5 business days. For an average residential subdivision with 8–10 soundings, we deliver the final report within 10 working days. Rush service (48 hours) is available for emergency assessments.
Location and service area
We serve projects across Houston and its metropolitan area.